Math Visualizations: I
Visualization of math concepts is made possible with the advances in technology. The simplest method of visualizing maths is graphing, either you use a graph paper or a digital graphing tool is your choice. With digital tools, we can share our creations easily with a large audience and the content will be engaging and interactive. In this first part of this series, we consider simple polynomials like linear and quadratic in the standard form and prepare their visualizations.
Visualization of Linear Equations:
the general or standard form of a linear polynomial (equation) is given by \(ax+b \)
Where:
- \(a \) is the coefficient of the linear term \(x \)
- \(b \) is the constant term
Let's Start:
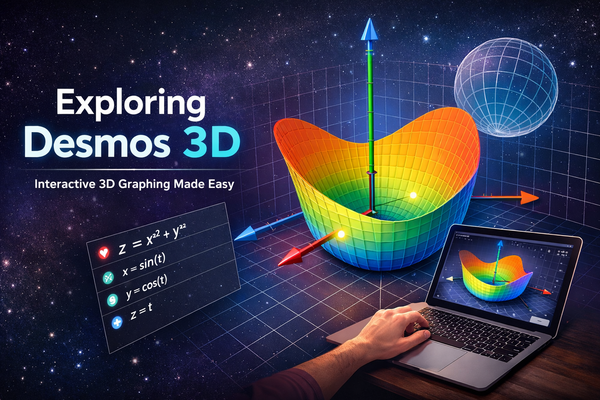
Following is the interactive visualization of the above linear function produced with the help of desmos, a graphing tool with many useful features. Interact with it using the sliders. Observe the changes in the graph.
Visualization of Quadratic Equations:
The general form of a quadratic equation is given by \(ax^2+bx+c\).
Where:
- "a" is the coefficient of the quadratic term \(x^2 \).
- "b" is the coefficient of the linear term \(x \).
- "c" is the coefficient of the constant term.
Let's Start:
Following is the interactive visualization of the above quadratic function produced with the help of desmos, a graphing tool. Interact with it using the sliders. Observe the changes in the graph.
Higher Order Polynomials:
The next visual is to Observe the shapes of the higher order Polynomials of the form \(ax^d+bx+c \).
If these visuals are coupled with good questions, understanding improves without any doubt. We design such observational questions in our Course Material that we provide to the Schools that We associate and Conduct hands on sessions to both teachers and students.
Are those visualizations make you Curious of Math? Are you interested in creating such Math Visualizations? What is your Observation.
What are your thoughts? your comments and suggestions are welcome. This makes us motivated and comes up with more engaging visualizations.
To further enhance your understanding join our growing community at sredsol community.